Agile Transformation Tip: Good Metrics Drive Changes in Behavior
Agile Transformation Tip: Good Metrics Drive Changes in Behavior
by Patrick Delany
At its core, an agile transformation is about changing the culture of an organization. Changing culture is hard and takes time. To change the organization’s culture, we need to change individual and group behaviors first. There is no way around this.
Changing behaviors is not easier either, but it is manageable in incremental steps. There are a lot of tools to help us do this. We can provide training, change reporting structures, revise incentive structures, etc.
As a coach, I find that selecting, measuring, and reporting on a few metrics at a time is a very effective way to change behaviors of agile teams and individuals. It is important to pick the right metrics based on the maturity level of the organization and the goals for the transformation. It is also important to change the metrics being measured and communicated every six to 12 months as behaviors change, agile competencies improve and the transformation gains momentum.
Early in a transformation, I like to focus on three team level metrics for scrum teams. Here are the early team metrics.
Estimating Accuracy (or Planned vs. Actual). One of the behaviors we want agile teams to learn and learn quickly is how to estimate work, plan two weeks of work and deliver on what they planned consistently over time. This create team accountability, reliability and short-term predictability.
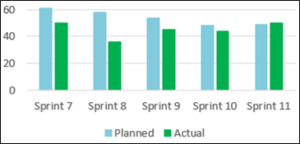
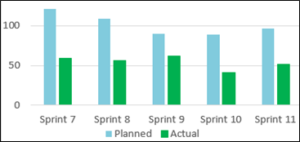
Estimating Accuracy is an easy metric to capture and most agile ALM tools like Jira, Azure DevOps, and Agile Central provide this metric right out of the box in the form of a Velocity History extension of report. The images below show the Velocity History for two different teams over six sprints.


Notice that Team 1 started out over estimating what they could deliver in Sprints 7, 8 and 9, but became much more accurate in Sprints 10 and 11. This is a team that is on the right track and is becoming reliable and predictable on a sprint basis. In contrast, Team 2 consistently over commits in every sprint and as a result is less predictable and reliable. There may be a few reasons for this, but it is an excellent opportunity for the team to take stock and discuss the why’s during their next Retrospective.
It is also important to note that the goal is not 100% accuracy. Expecting 100% accuracy every sprint will result in teams not taking risks and ultimately producing less. Generally, 80-90% accurate is acceptable depending on the context of the work. Additionally, it is important to look at the trend over several sprints. Even mature teams have a bad sprint or two from time to time. We are looking for patterns.
Velocity Sustainability. Where Estimating Accuracy (or Planned vs. Actual) pushes a team to be reliable or predictable on a sprint basis, Velocity Sustainability, encourages a team to be consistent from sprint to sprint to sprint. Creating visibility around Velocity Sustainability helps break the cycle of last-minute heroics and team burnout. Remember from Agile Manifesto Principal 8, we want the teams to be able to work at a steady pace indefinitely. It also helps make the team predictable over a longer timeframe.
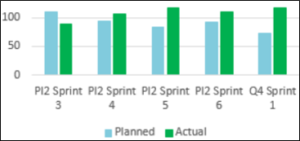
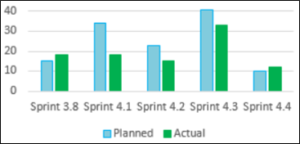
Velocity Sustainability is easily measured from the same Velocity History chart. In the images below, you will see Team 3 has good velocity sustainability where Team 4 is not. Team 4 is predictable on a sprint basis, but not over the medium term or a period of multiple of Sprints.


Again, even mature teams will have “valley’s in their Velocity History. Often there are good reasons for this. If you are following the Scaled Agile Framework (SAFe), team velocity will decrease during the Innovation and Planning Iteration at the end of each PI. Additionally, all teams will see a dip in velocity in late December because of the holidays.
Backlog Health. Finally, Backlog Health measures how much ready and refined work or user stories the team has in its backlog after the current sprint. By measuring Backlog Health, we help break the anti-pattern of just in time refinement. This is a particularly good tool for forcing teams to schedule and conduct backlog refinement in advance of Sprint Planning.
Backlog Health is harder to measure than Estimating Accuracy and Velocity Sustainability. To do this, you need to be able write queries that sums the story points of ready user stories in all future sprints and the backlog then divide the total by the team’s average velocity for the past three or four sprints. As a rule of thumb, a team should have one to three sprints worth of user stories refined and ready.
Because it is harder to measure, Backlog Health is not often measured early in a transformation. This is a shame. Backlog Health is probably the best and most impactful metric for teams. Teams that regularly refine user stories in advance of Sprint Planning almost always outperform teams that do not. Or another way of looking at this is that teams who maintain a health backlog generally are better at estimating and maintaining sustainable velocity.
In short, institution just a few metrics on agile performance can go a long way to changing behaviors and ultimately changing culture.
 Patrick Delany is a leader in lean-agile enterprise transformational and a Scaled Agile Coach/Trainer with over 20 years of information technology leadership and consulting experience. Patrick has transformed technology organizations, programs, and teams across multiple industries and technology disciplines including management services (operations, program, portfolio), applications development, and infrastructure.
Patrick Delany, MBA, SPC5, PMP, CSM, ITIL v3
Senior Lean-Agile Transformation Coach Consultant
